IELTS Academic Writing Task 1
This page covers all the basic information you need to know about IELTS Academic Writing Task 1.
It includes:
- Key information
- Task overview
- Assessment & marking criteria
- The 7 types of questions
- Sample questions
Once you have a good understanding of Task 1, I’ll show you step-by-step how to produce high scoring essays for each of the 7 types of questions. You’ll find all these important lessons by following the links to the related pages.
Key Information
1) You are required to write 150 words or more.
If you write less than 150 words, you are unlikely to get more than a Band 5 for ’task achievement’ as you won’t have fulfilled the marking criteria.
2) You have around 20 minutes to plan and write your essay.
3) You should use a formal style of writing.
4) Task 1 contributes half as many marks to your score as Task 2. So, Task 1 is worth 33% of the total mark in the Writing test.
Task Overview
You will be presented with one of the following graphics:
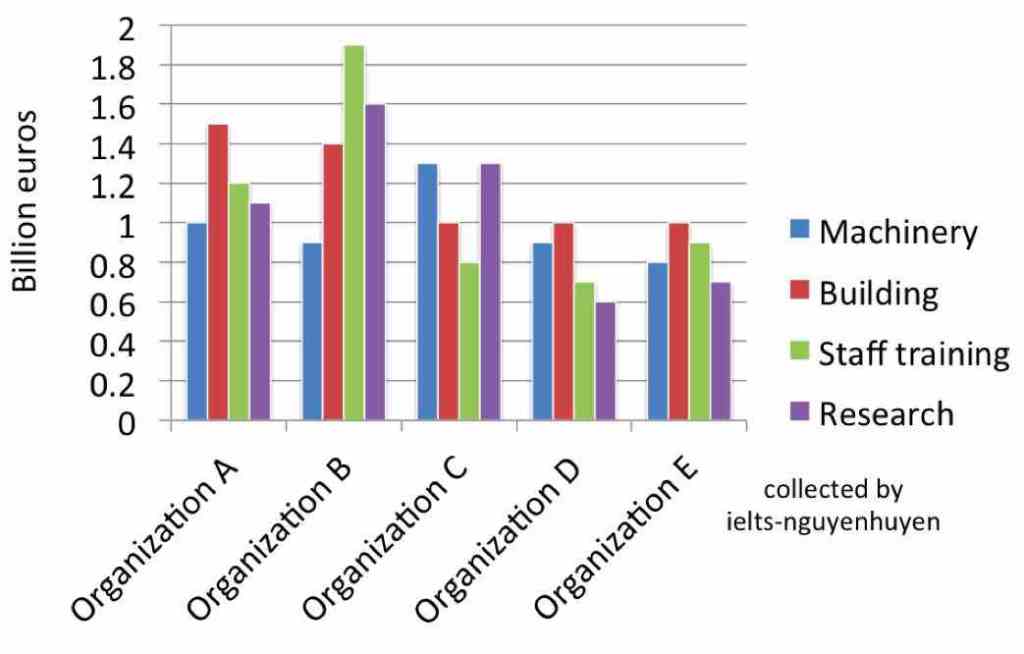
- Bar Chart
- Line Graph
- Table Chart
- Pie Chart
- Process Diagram
- Map
- Multiple Graphs

You are required to write a short report about the main features. For example, you may be asked to:
· summarise data
· describe the stages of a process
· explain how something works
· describe an object or event
The format of the question will always be the same. It will include:
· A brief description of the graphic
· The instructions
· The graphic – chart, graph, table, etc.
Here’s a typical question. The highlighted words are always the same no matter what type of question you get.
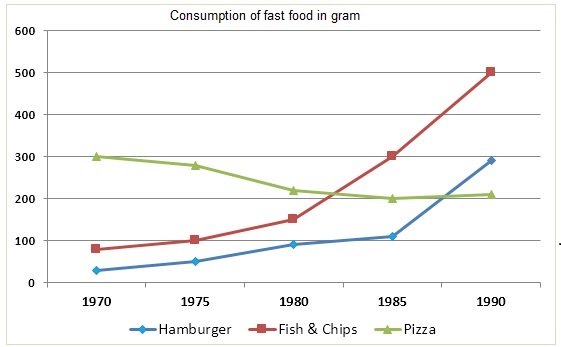
The line graph below shows the consumption of 3 different types of fast food in Britain from 1970 to 1990.
Summarise the information by selecting and reporting the main features, and make comparisons where relevant.
With the format of the question always the same, this means that you can use the same basic method and essay structure to write any essay for IELTS Academic Writing Task 1.
We’ll be looking at a model method and structure in the lesson on Planning an IELTS Academic Writing Task 1 Essay.
Assessment & Marking Criteria
As with all parts of the IELTS exam, Task 1 is marked according to four criteria.
These are:
- Task Achievement – appropriate response to the task
- Cohesion & Coherence – the ability to present a well-structured essay
- Lexical Resource (Vocabulary) – the ability to use a range of appropriate vocabulary and to use it correctly
- Grammatical Range & Accuracy – the ability to use grammar correctly and to use a range of grammar forms
Each carries 25% of the marks.
I’ve created separate lessons on Vocabulary and Grammar for Task 1, so here, we’ll look in more detail at just the marking criteria for Task Achievement and Coherence and Cohesion. We’re going to focus on Bands 6 – 8 as these are the levels most students are aiming for.
You can see a full table of all the band level marking criteria for Writing Task 1 by clicking this link – Task 1 Marking Criteria.
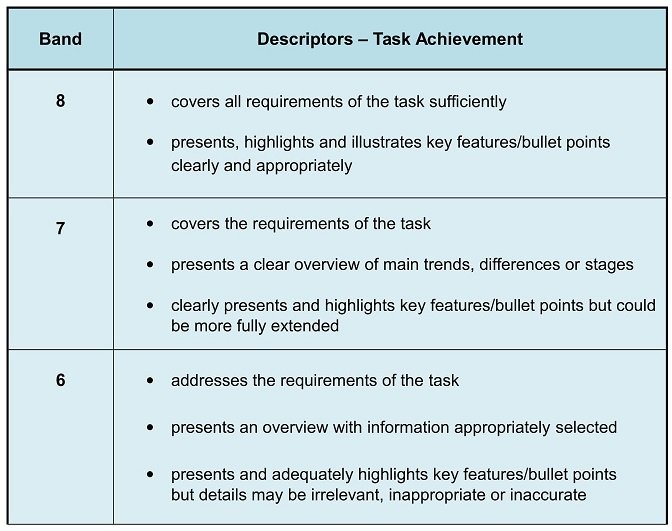
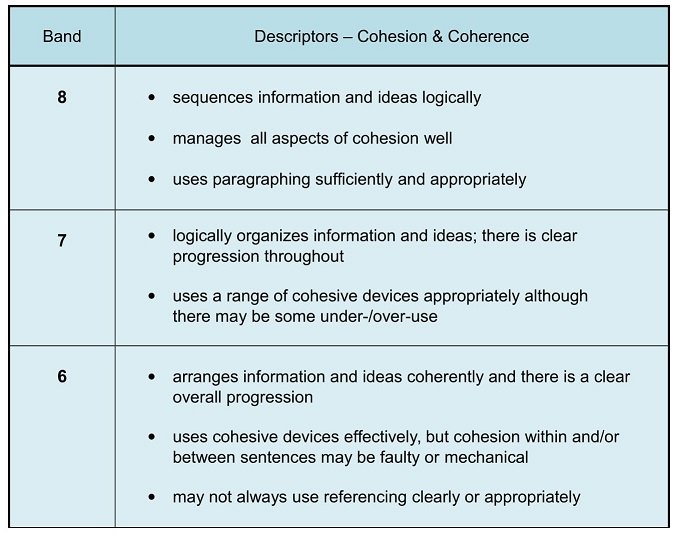
Here are the marking criteria for Task Achievement and Coherence and Cohesion. Don’t worry if the detail seems rather complex. Don’t feel overwhelmed. If you follow my advice in all the lessons on how to write essays for IELTS Academic Writing Task 1, you’ll be able to meet these criteria and get a good score.
Marking Criteria – Task Achievement
Marking Criteria – Cohesion & Coherence
The 7 Types of Task 1 Questions
Now, we’re going to look briefly at the different type of questions for IELTS Academic Writing Task 1 and a sample question for each.
The biggest challenge for many students is that they are not used to working with charts, graphs and tables and don’t know how to interpret this type of data. Don’t worry about this for now as I’m going to show you how to do this in the step-by-step guides.
On this page, I just want to familiarise you with the question structure and the different types of graphics you might get.
First, a reminder of the 7 question types:
- Bar Chart
- Line Graph
- Table Chart
- Pie Chart
- Process Diagram
- Map
- Multiple Graphs
Click the links for step-by-step instructions on how to write each type of essay, including a model answer.
1) Bar Chart
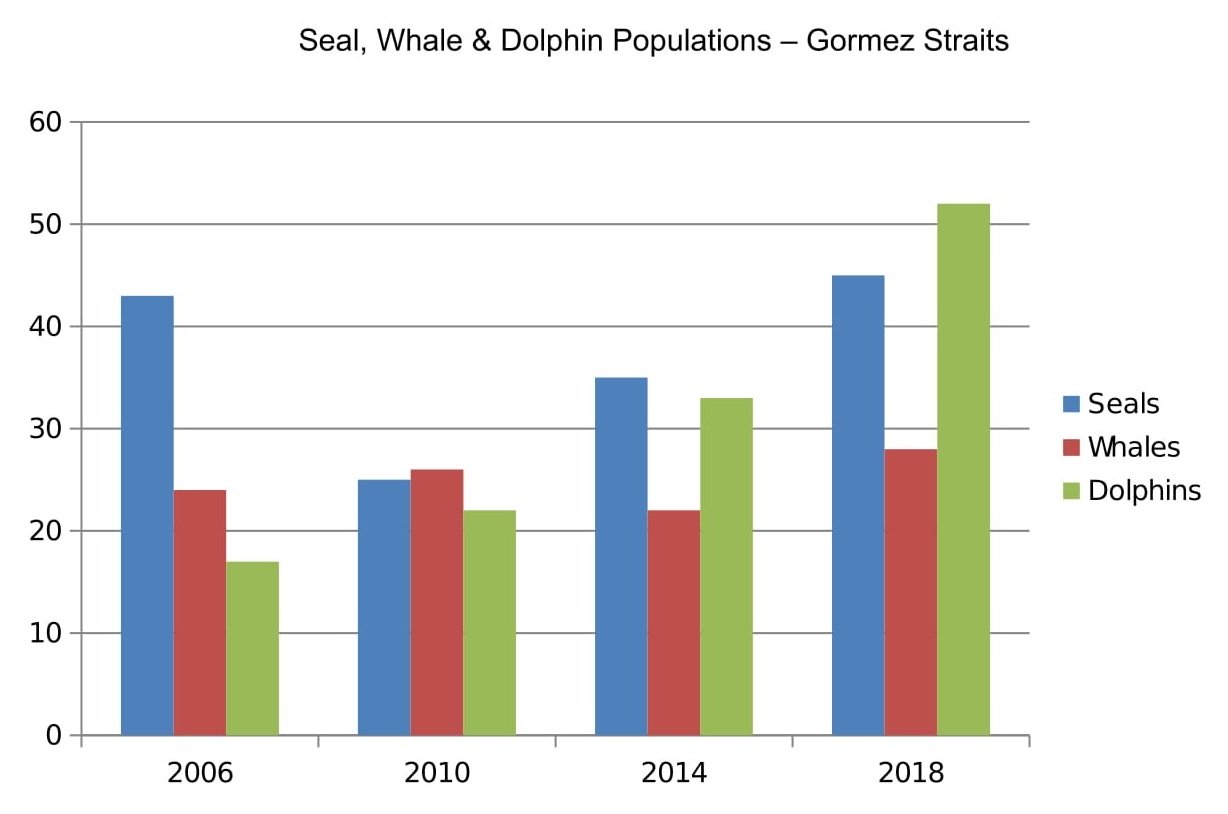
Bars charts or bar graphs are very common Task 1 questions. The data can be presented vertically, as in the example below, or horizontally.
Example:
The bar chart below shows numbers of seals, whales and dolphins recorded in the Gormez Straits from 2006 to 2018.
Summarise the information by selecting and reporting the main features, and make comparisons where relevant.
Write at least 150 words.
2) Line Graph
Line graphs are also common in IELTS Academic Writing Task 1. They are easier to interpret than they may look.
Example:
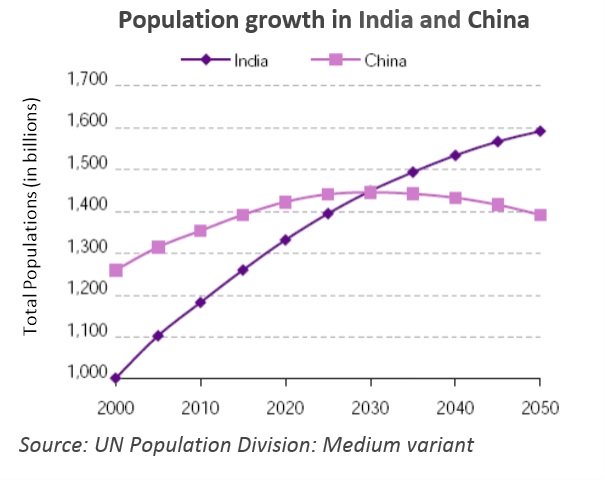
The graph below shows the population for India and China since the year 2000 and predicts population growth until 2050.
Summarise the information by selecting and reporting the main features, and make comparisons where relevant.
Write at least 150 words.
Source: Official website IELTS Essentials
3) Table
Tables also come up regularly in Task 1. Some students find these harder to interpret as they are just sets of numbers with no visual representation. However, they are never very complicated. Remember, the IELTS exam is designed to test your language skills, not your mathematics ability.
Example:
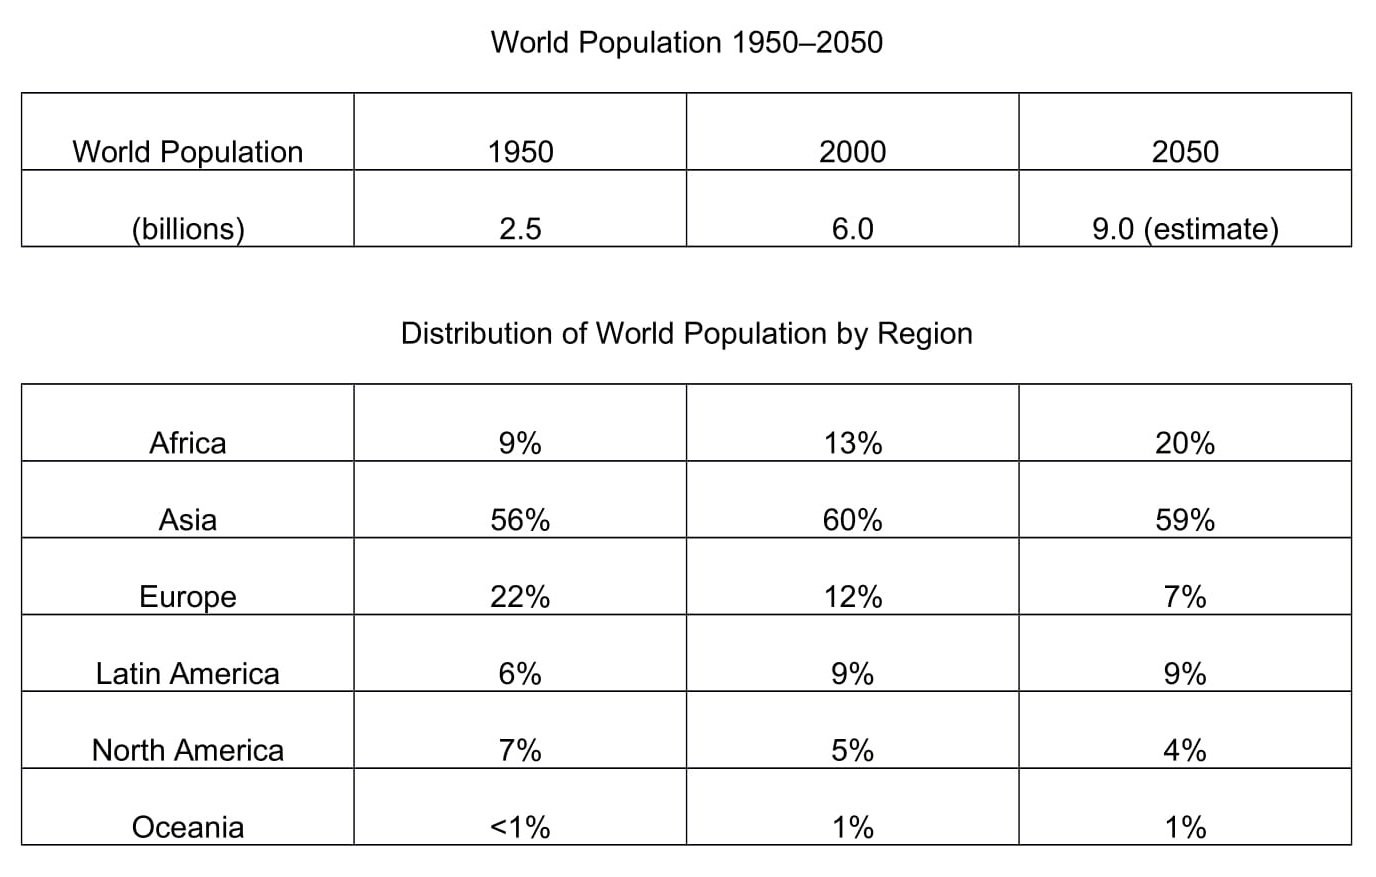
The tables below give information about the world population and distribution in 1950 and 2000, with an estimate of the situation in 2050.
Summarise the information by selecting and reporting the main features, and make comparisons where relevant.
Write at least 150 words.
Click this link for step-by-step instructions on how to answer this question including a model answer:
Table Chart – Instructions & Model Answer
4) Pie Chart
Although pie charts are not as common as bar charts and line graphs, you need to know how to answer this type of question in case you do get one. They are just another way of visually presenting data.
Example:
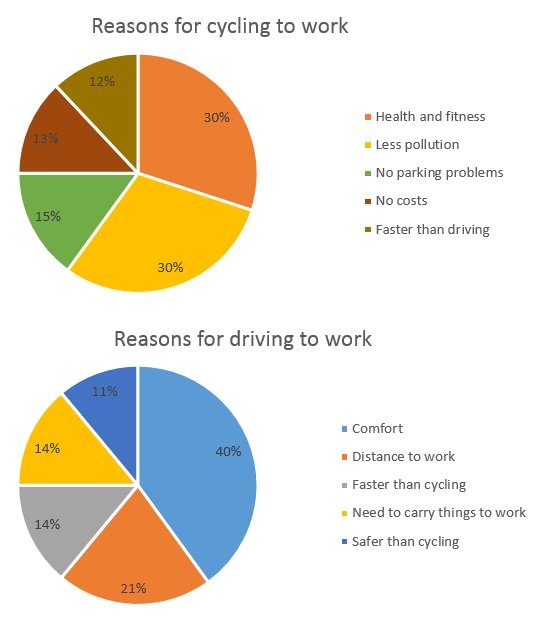
The chart below shows the reasons why people travel to work by bicycle or by car.
Summarise the information by selecting and reporting the main features, and make comparisons where relevant.
Write at least 150 words.
Source: Official website IELTS Essentials
Click this link for step-by-step instructions on how to answer this question including a model answer:
Pie Chart – Instructions & Model Answer
5) Process Diagram
Another less frequent question type is the process diagram. It could be a natural process such as the water cycle, a manufacturing process or the diagram of a system such as the central heating system in a house.
Example:
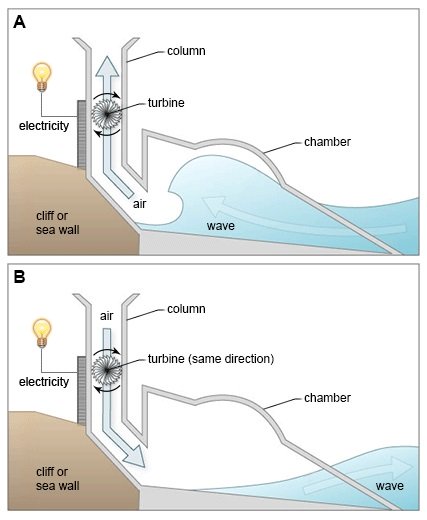
The diagrams below show a structure that is used to generate electricity from wave power.
Summarise the information by selecting and reporting the main features, and make comparisons where relevant.
Write at least 150 words.
Generating Electricity From The Sea
Source: Official website IELTS Essentials
Click this link for step-by-step instructions on how to answer this question including a model answer:
Process Diagram – Instructions & Model Answer
6) Map
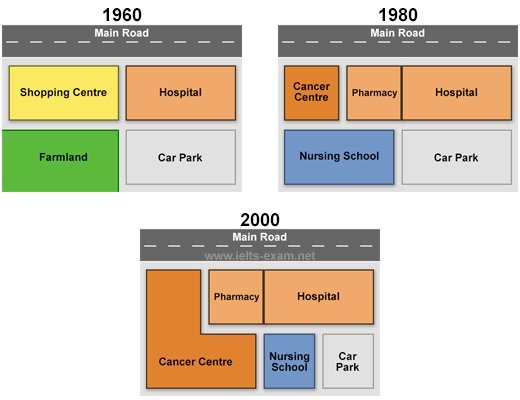
Occasionally, the IELTS Academic Writing Task 1 question will be about a map. It may ask you to compare two or three maps of a place over a period of time as in this question.
Example:
The diagrams below show the changes that have taken place at Queen Mary Hospital since its construction in 1960.
Summarise the information by selecting and reporting the main features, and make comparisons where relevant.
Write at least 150 words.
Source: Official website IELTS Essentials
7) Multiple Graphs
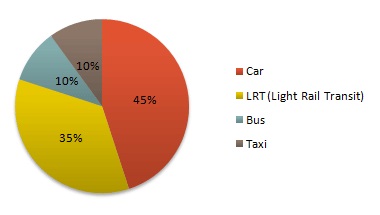
Multiple graph questions have more than one type of diagram and are fairly common. They usually include two diagrams such as a bar chart and a line graph or a pie chart and a table as in this sample question.
Example:
The diagrams below give information on transport and car use in Edmonton.
Summarise the information by selecting and reporting the main features, and make comparisons where relevant.
Write at least 150 words.

Source: Official website IELTS Essentials
Now that you have a better understanding of IELTS Academic Writing Task 1 and are familiar with the 7 different question types, you’re ready to learn how the write a Task I essay.
Just follow the links below to the individual lessons.

